 AppWishMark



About
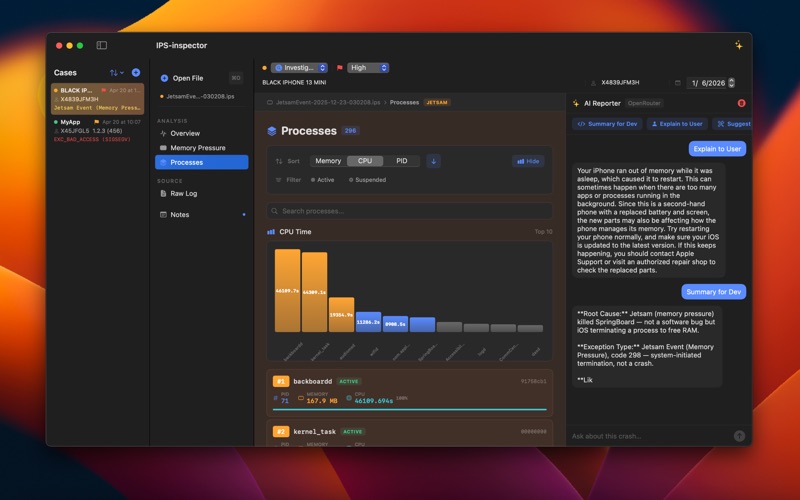
IPS Inspector is designed to analyze and understand .ips crash logs with ease. Key Features: - Dual-Format Support: Analyze both traditional text-based crash reports (.ips, .crash, .txt) and JSON-formatted Jetsam memory pressure events - Intelligent Parsing: Automatically detects and parses crash report format, extracting critical information including exception details, thread stack traces, and process information - Memory Pressure Analysis: Specialized view for Jetsam events with detailed memory statistics, process rankings, and visual graphs - Three-Column Layout: Cases sidebar, structured analysis navigation, and detail view — everything organized in one window - Case Management: Every report you open is saved as a persistent case with status (New / Investigating / Fixed / Won't Fix), priority, client name, received date, and freeform notes — all preserved across launches - AI Reporter: Built-in AI assistant with full crash report context. Ask questions, request root-cause summaries, and explore specific threads. Supports Ollama (local), OpenRouter, and Claude / Anthropic - Notes: Per-case notes with two tabs — your own notes and pinned AI analysis — kept alongside each crash report - Advanced Process Inspection: Sort and filter processes by memory usage, CPU time, or PID with active/suspended state filtering - Thread Analysis: Examine crashed threads with complete stack traces and symbol information - Fast Performance: Optimized to handle large crash logs (100,000+ lines) with sub-second load times using native macOS components - Search & Filter: Powerful search capabilities across processes, threads, and binary images - Visual Graphs: Interactive bar charts showing memory and CPU usage across top processes